How to Create a Pie Chart with Kotlin

The Pie Chart is a type of UI Interface that is used to display the data in the form of percentages in different categories. This is used for a large number of data when using Pie charts. We will take one example of a pie chart.

Here is the step-by-step Implementation process:


Step 1: Create a new project in Android or you can use an already created project.  


Step 2: Add dependency of razor pay in build.gradle file on Gradle

scripts>Build.gradle app module and add the below dependencies.

implementation ‘com.github.PhilJay:MPAndroidChart:v3.1.0’// add latest version of MPAndroidChart

Step 3: Add permission to the internet in app> Androidmanifest.xml file and below code.

<uses-permission android:name="android.permission.INTERNET" />


Step 4: Create an activity_main.xml file in the layout folder.

<?xml version="1.0" encoding="utf-8"?>

<androidx.constraintlayout.widget.ConstraintLayout xmlns:android="http://schemas.android.com/apk/res/android"

xmlns:app="http://schemas.android.com/apk/res-auto"

xmlns:tools="http://schemas.android.com/tools"

android:layout_width="match_parent"

android:layout_height="match_parent"

tools:context=".MainActivity">


<TextView

android:id="@+id/textView"

android:layout_width="wrap_content"

android:layout_height="wrap_content"

android:layout_alignParentEnd="true"

android:layout_marginTop="60dp"

android:text="Pie chart demo"

android:textSize="18sp"

android:textStyle="bold"

app:layout_constraintEnd_toEndOf="parent"

app:layout_constraintStart_toStartOf="parent"

app:layout_constraintTop_toTopOf="parent" />


//Pie Chart display

<com.github.mikephil.charting.charts.PieChart

android:id="@+id/pieChart"

android:layout_width="300dp"

android:layout_height="300dp"

android:layout_centerHorizontal="true"

android:layout_marginTop="52dp"

app:layout_constraintEnd_toEndOf="parent"

app:layout_constraintStart_toStartOf="parent"

app:layout_constraintTop_toBottomOf="@+id/textView"

tools:ignore="MissingClass,MissingConstraints" />


<ImageView

android:id="@+id/glideimageloaderr"

android:layout_width="55dp"

android:layout_height="48dp"

android:layout_margin="15dp"

android:src="@drawable/company_logo"

app:layout_constraintEnd_toEndOf="parent"

app:layout_constraintTop_toTopOf="parent" />

</androidx.constraintlayout.widget.ConstraintLayout>

Step 5: Create a MainActivity.kt file in your packages folder.

import android.graphics.Color

import android.graphics.Typeface

import android.os.Bundle

import androidx.activity.enableEdgeToEdge

import androidx.appcompat.app.AppCompatActivity

import androidx.core.view.ViewCompat

import androidx.core.view.WindowInsetsCompat

import com.github.mikephil.charting.animation.Easing

import com.github.mikephil.charting.charts.PieChart

import com.github.mikephil.charting.data.PieData

import com.github.mikephil.charting.data.PieDataSet

import com.github.mikephil.charting.data.PieEntry

import com.github.mikephil.charting.formatter.PercentFormatter

import com.github.mikephil.charting.utils.MPPointF


class MainActivity2: AppCompatActivity() {

lateinit var pieChart: PieChart

override fun onCreate(savedInstanceState: Bundle?) {

super.onCreate(savedInstanceState)

setContentView(R.layout.activity_main)

pieChart = findViewById(R.id.pieChart)


// setting description as enabled and offset for pie chart

pieChart.setUsePercentValues(true)

pieChart.getDescription().setEnabled(false)

pieChart.setExtraOffsets(5f, 10f, 5f, 5f)


// on below line we are setting drag for our pie chart

pieChart.setDragDecelerationFrictionCoef(0.95f)


// on below line we are setting hole

// and hole color for pie chart


pieChart.setDrawHoleEnabled(true)

pieChart.setHoleColor(Color.WHITE)


// on below line we are setting circle color and alpha

pieChart.setTransparentCircleColor(Color.WHITE)

pieChart.setTransparentCircleAlpha(110)

pieChart.setHoleRadius(58f)


pieChart.setTransparentCircleRadius(61f)

// on below line we are setting center text


pieChart.setDrawCenterText(true)

// rotation for our pie chart


pieChart.setRotationAngle(0f)

// enable rotation of the pieChart by touch


pieChart.setRotationEnabled(true)

pieChart.setHighlightPerTapEnabled(true)

// on below line we are setting animation for our pie chart

pieChart.animateY(1400, Easing.EaseInOutQuad)

// on below line we are disabling our legend for pie chart

pieChart.legend.isEnabled = false

pieChart.setEntryLabelColor(Color.WHITE)

pieChart.setEntryLabelTextSize(12f)


// adding data to it to display in pie chart

val entries: ArrayList<PieEntry> = ArrayList()

entries.add(PieEntry(40f))

entries.add(PieEntry(30f))

entries.add(PieEntry(30f))


// on below line we are setting pie data set

val dataSet = PieDataSet(entries, "Mobile OS")

dataSet.setDrawIcons(false)


// on below line we are setting slice for pie

dataSet.sliceSpace = 3f

dataSet.iconsOffset = MPPointF(0f, 40f)

dataSet.selectionShift = 5f

// add a lot of colors to list

val colors: ArrayList<Int> = ArrayList()


colors.add(resources.getColor(R.color.purple_200))

colors.add(resources.getColor(R.color.yellow))

colors.add(resources.getColor(R.color.red))

// on the below line we are setting colors.

dataSet.colors = colors

// on below line we are setting pie data set

val data = PieData(dataSet)

data.setValueFormatter(PercentFormatter())

data.setValueTextSize(15f)

data.setValueTypeface(Typeface.DEFAULT_BOLD)

data.setValueTextColor(Color.WHITE)

pieChart.setData(data)

pieChart.highlightValues(null)

// loading chart

pieChart.invalidate()

}

}

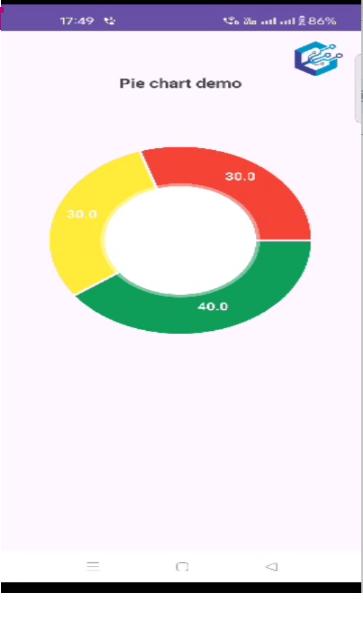
Step 6: Output of pie chart demo.

Happy coding!

365Bloggy May 6, 2024
Share this post
Tags
SUBSCRIBE THIS FORM


Archive